Poging GOUD - Vrij
Academic Learning Solutions - Data Visualization: What Is It?
Ga onbeperkt met Magzter GOLD
Lezen Academic Learning Solutions samen met 9000+ andere tijdschriften en kranten met slechts één abonnement
Bekijk catalogusAbonneer u alleen op Academic Learning Solutions
Op elk gewenst moment opzegbaar.
(Geen verplichtingen) ⓘAls u niet tevreden bent met uw abonnement, kunt u binnen 7 dagen na de ingangsdatum van het abonnement een e-mail sturen naar help@magzter.com voor een volledige terugbetaling. Geen vragen gesteld - beloofd! (Let op: niet van toepassing op losse nummers)
Digitaal abonnement
Directe toegang ⓘAbonneer je nu en begin direct met lezen via de Magzter website, iOS, Android en Amazon apps.
Geverifieerd beveiligd
betaling ⓘMagzter is een geverifieerde Stripe-handelaar.
In dit nummer
Discover the Applications, Advantages, Difficulties, and Best Practices of Data Visualization
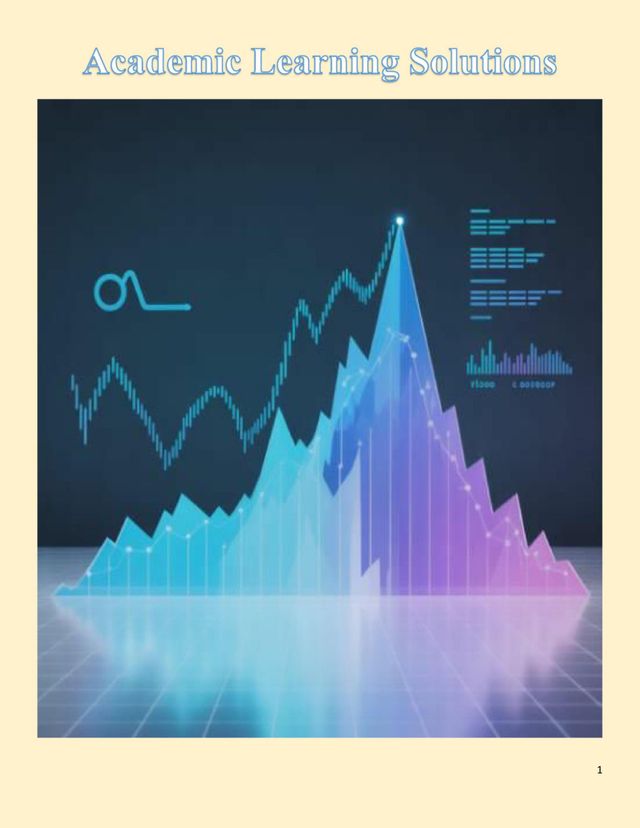
The graphical display of information and data using visual components such as maps, graphs, and charts is known as data visualization. It enables decision-makers to comprehend and express complex concepts, enabling quicker responses to operational problems or market changes. Businesses that depend on gathering and organizing vast volumes of data for analysis will find this to be quite helpful.
To reap these benefits, companies must invest in proper tools and training, which can pose challenges for smaller businesses with limited budgets.
What is the Process of Data Visualization?
Data visualization is the process of transforming data into graphical representations. This method is often more intuitive and efficient than analyzing spreadsheets or text reports.
Large datasets are processed by tools and software, which then visually represent the data to show trends, correlations, and patterns that may not be seen in the raw data.
Academic Learning Solutions Description:
Empower your academic journey with our comprehensive Academic Learning Solutions. Tailored to meet diverse educational needs, our innovative tools and resources ensure a dynamic and effective learning experience. Elevate your academic success with personalized solutions designed for students, educators, and institutions alike. Explore a world of possibilities and unlock your full learning potential with our Academic Learning Solutions.
Recente nummers

The Relationships and Differences Between Data Engineering and Data Science

How Does Accounting Use Data Analytics?

List to String Conversion Program in Python: The Art of Python

Will AI Take My Job Away? How Professionals in the MENA Region Can Get Ready
")
Advantages of Total Quality Management (TQM)

Best Professional Course Following Graduation

AI's Future: Trends, Effects, and Forecasts

The Function of Quality Assurance and Quality Control

Is AI Difficult to Learn - A Complete Guide
 Types")
A Comprehensive Guide to Quality Management System (QMS) Types

Selecting Excellence in Total Quality Management vs. Six Sigma

The Top 20 Ways to Motivate Employees

Is Learning Python Easy? Discover the Truth Right Now!
")
Software Quality Assurance (SQA)
")
A Quality Manual (QMS)

The 7-S Framework

Ten Future Jobs That Could Change Your Destiny
Gerelateerde titels

International Journal of Education and Management Studies

SOPHOS

English Vocabulary Made Easy

English Language for Competitive Exams

General Science

Curries from the South

English Reading Comprehension

Science

Herbal Cure

English Grammar & Composition

A To Z of Internet

Banking Awareness

101 Inspiring lives

Data Science Future

Naturopathy

Quiz Time Science & Technology

English Grammar Workbook

English Workbook Class 1

Objective Computer Awareness

Dictionary of Legal Terms

Electronics Projects for Beginners

Face Reading

Computer Workbook Class 3

Progression Economics

Verbal Reasoning - English

Mathematics

English Workbook Class 5

English Workbook Class 2

Mathematics Workbook Class 1

Electrical & Electronics Projects