
Go Unlimited with Magzter GOLD
Get unlimited access to 10,000+ magazines, newspapers and Premium stories for just
Try GOLD - Free
Go Unlimited with Magzter GOLD
Get unlimited access to 10,000+ magazines, newspapers and Premium stories for just
Hurry, Limited Period Offer!
0
Hours
0
minutes
0
seconds
Academic Learning Solutions Magazine - The Relationships and Differences Between Data Engineering and Data Science
Go Unlimited with Magzter GOLD
Read Academic Learning Solutions along with 10,000+ other magazines & newspapers with just one subscription
View CatalogSubscribe only to Academic Learning Solutions
Cancel Anytime.
(No Commitments) ⓘIf you are not happy with the subscription, you can email us at help@magzter.com within 7 days of subscription start date for a full refund. No questions asked - Promise! (Note: Not applicable for single issue purchases)
Digital Subscription
Instant Access ⓘSubscribe now to instantly start reading on the Magzter website, iOS, Android, and Amazon apps.
Verified Secure
payment ⓘMagzter is a verified Stripe merchant.
In this issue
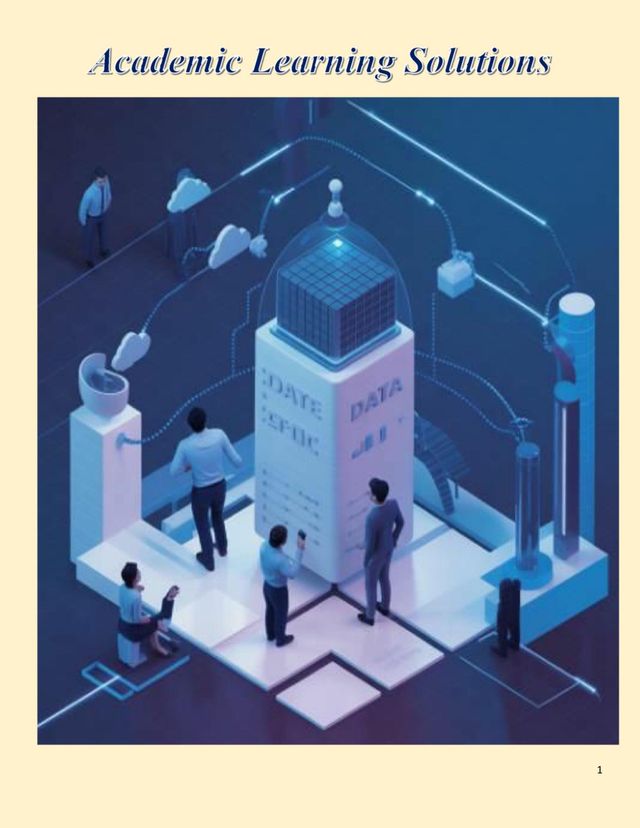
Accurate data collection is the first step in any sound business decision. Scientists steer the infrastructure while engineers build it. Each function depends on the other, and both flourish when communication is smooth.
This collaboration serves as an anchor for digital growth in contemporary businesses. While science gives meaning and motivates action, engineering maintains the stability of information systems. By working together, professionals who use these ideas transform unprocessed data into strategic value. Let's examine how these positions can accelerate an organization's growth
Academic Learning Solutions Magazine Description:
Empower your academic journey with our comprehensive Academic Learning Solutions. Tailored to meet diverse educational needs, our innovative tools and resources ensure a dynamic and effective learning experience. Elevate your academic success with personalized solutions designed for students, educators, and institutions alike. Explore a world of possibilities and unlock your full learning potential with our Academic Learning Solutions.
Recent issues

Data Visualization: What Is It?

How Does Accounting Use Data Analytics?

List to String Conversion Program in Python: The Art of Python

Will AI Take My Job Away? How Professionals in the MENA Region Can Get Ready
")
Advantages of Total Quality Management (TQM)

Best Professional Course Following Graduation

AI's Future: Trends, Effects, and Forecasts

The Function of Quality Assurance and Quality Control

Is AI Difficult to Learn - A Complete Guide
 Types")
A Comprehensive Guide to Quality Management System (QMS) Types

Selecting Excellence in Total Quality Management vs. Six Sigma

The Top 20 Ways to Motivate Employees

Is Learning Python Easy? Discover the Truth Right Now!
")
Software Quality Assurance (SQA)
")
A Quality Manual (QMS)

The 7-S Framework

Ten Future Jobs That Could Change Your Destiny
Related Titles

International Journal of Education and Management Studies

SOPHOS

English Vocabulary Made Easy

English Language for Competitive Exams

General Science

Curries from the South

English Reading Comprehension

Science

Herbal Cure

English Grammar & Composition

A To Z of Internet

Banking Awareness

101 Inspiring lives

Data Science Future

Naturopathy

Quiz Time Science & Technology

English Grammar Workbook

English Workbook Class 1

Objective Computer Awareness

Dictionary of Legal Terms

Electronics Projects for Beginners

Face Reading

Computer Workbook Class 3

Progression Economics

Verbal Reasoning - English

Mathematics

English Workbook Class 5

English Workbook Class 2

Mathematics Workbook Class 1

Electrical & Electronics Projects